
Avenislabs · Windows desktop · early alpha
Open the whole survey.
Cut it anywhere.
Prove what you export.
Pointglass is a viewer and light editor for large classified LiDAR point clouds. It reads LAS and LAZ, indexes them into a spatial store you can actually work in, and writes ASPRS LAS back out with every point record copied byte for byte.
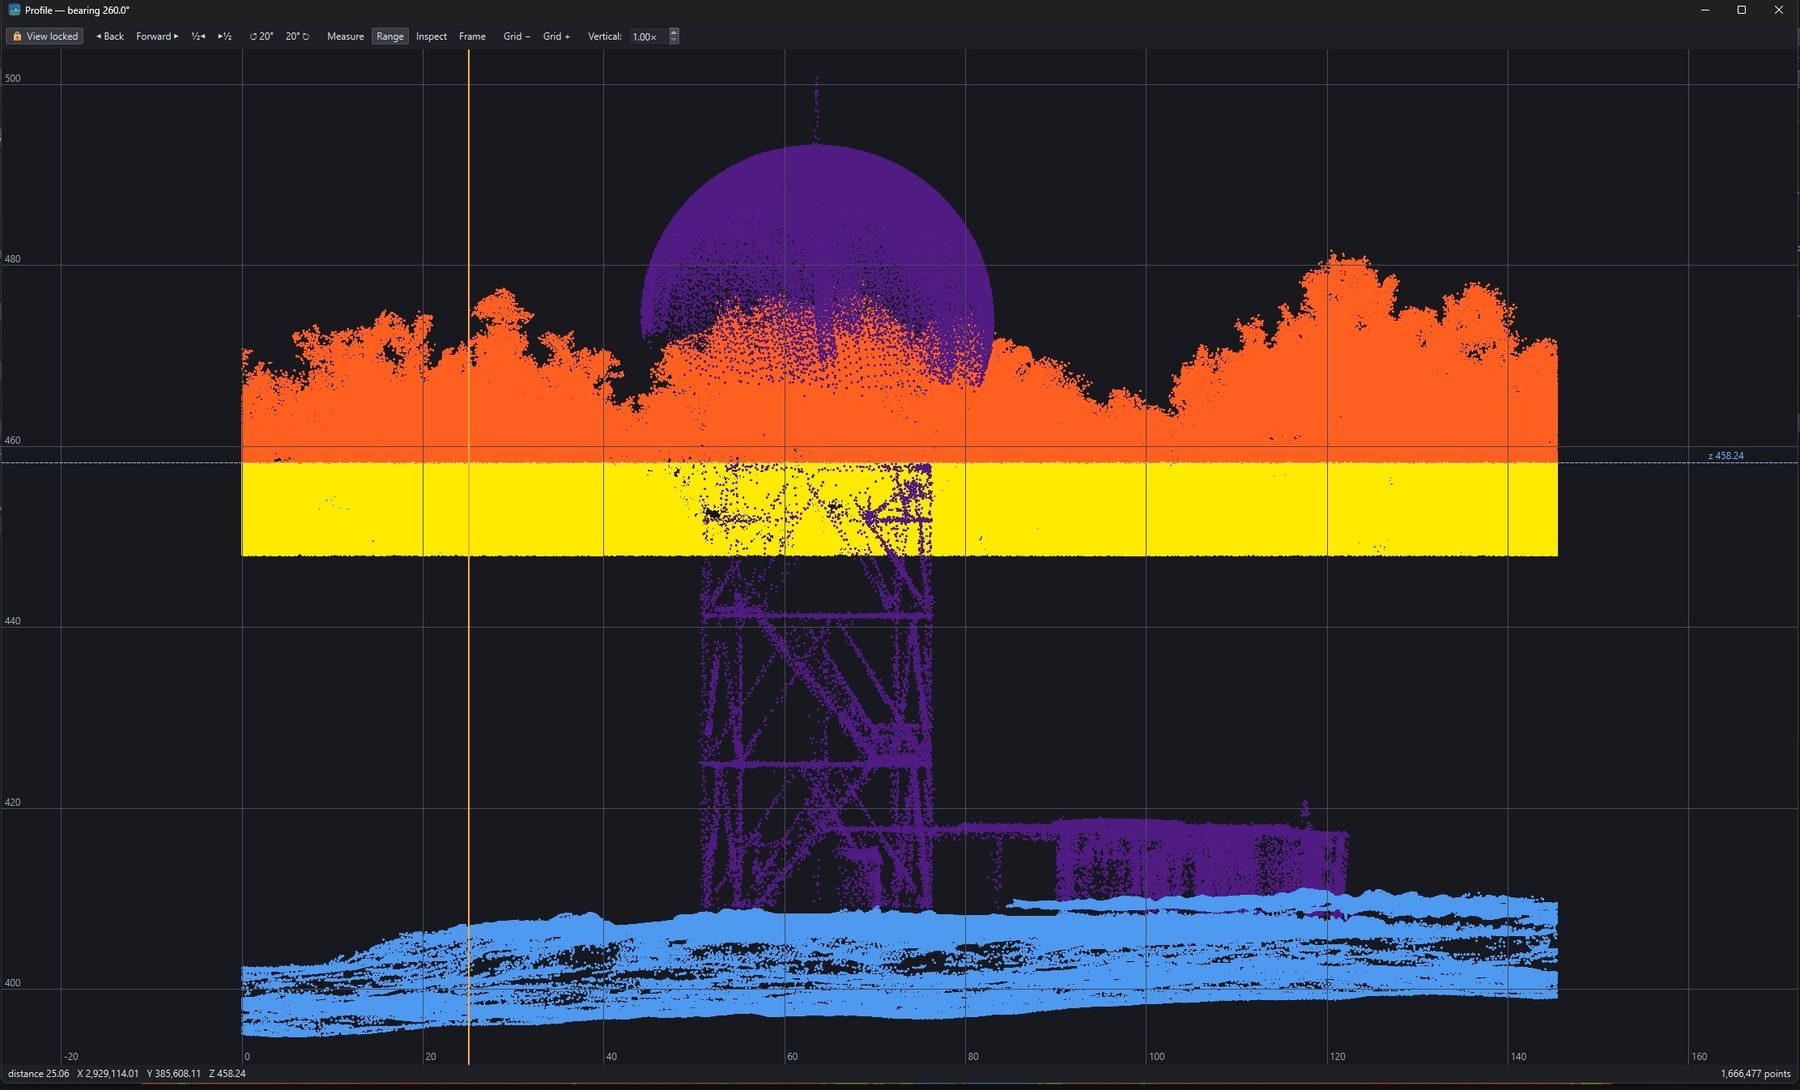
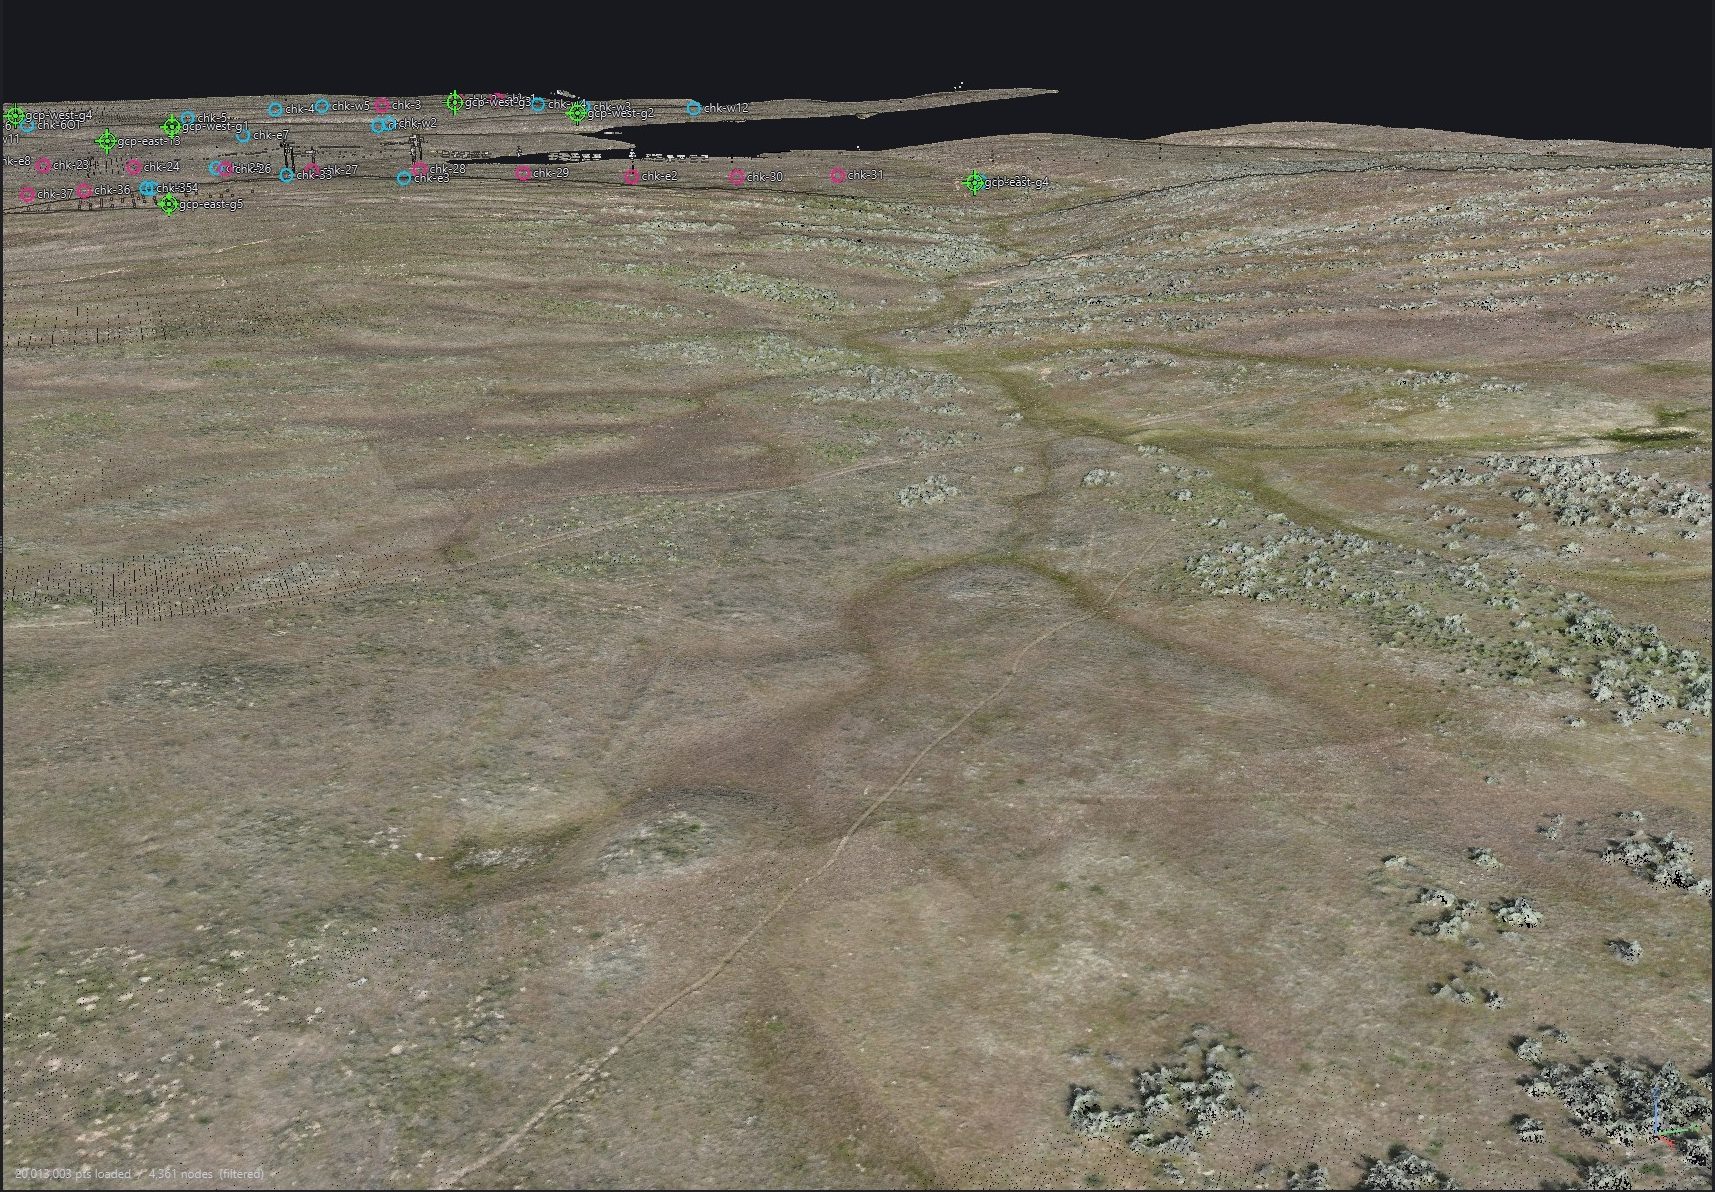
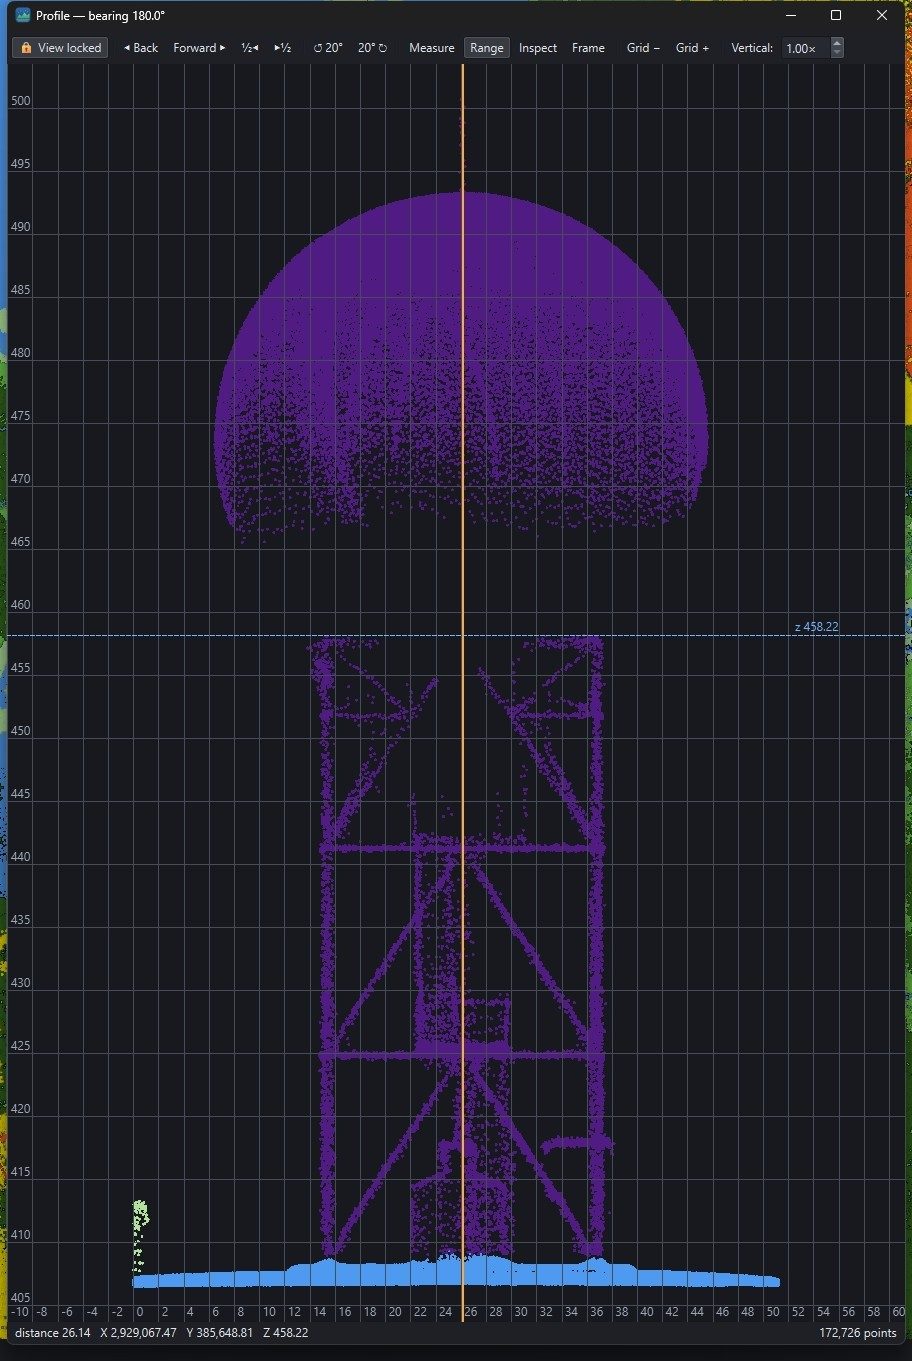
A cross-section is the fastest way to answer a question about a cloud
Draw a corridor in the map and inspect it side-on in its own window. The extractor descends the whole octree rather than the render budget, so what you are looking at is every point in that corridor — not a sample of it.
Walk the corridor along its axis, or rotate it 20° at a time about its midpoint to square the section up to a feature. The vertical exaggeration is a control, not a guess, and the elevation line reads in the project's own units.
- Full density. 172,726 points in the section on the right, from a 217-million-point store.
- Its own window. Pop it out to a second monitor and keep orbiting the map.
- Measure inside it. The section is a working view, not a preview.
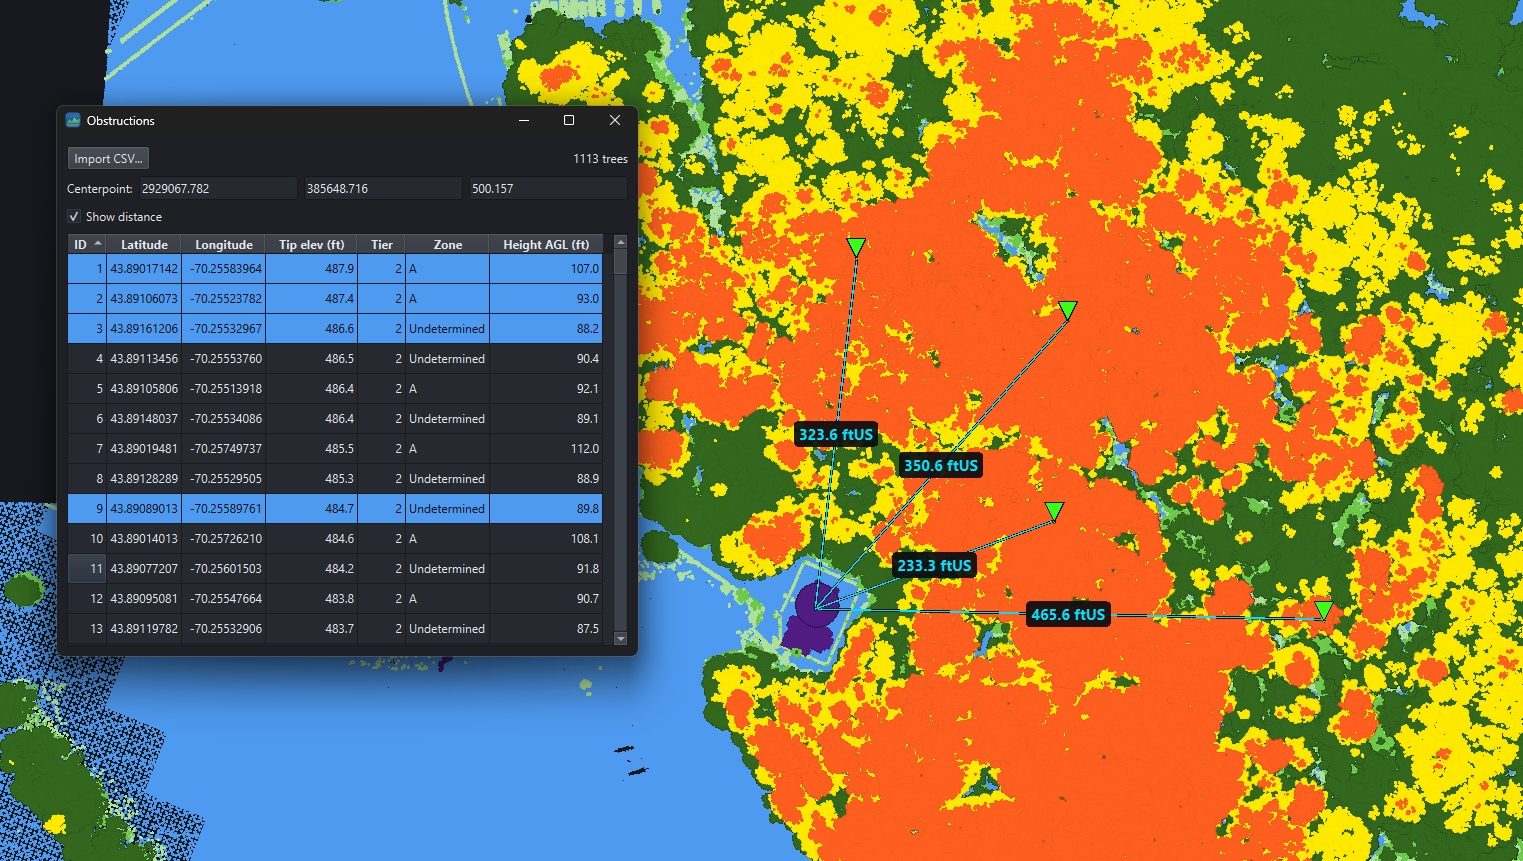
Every tree tip, where it was measured
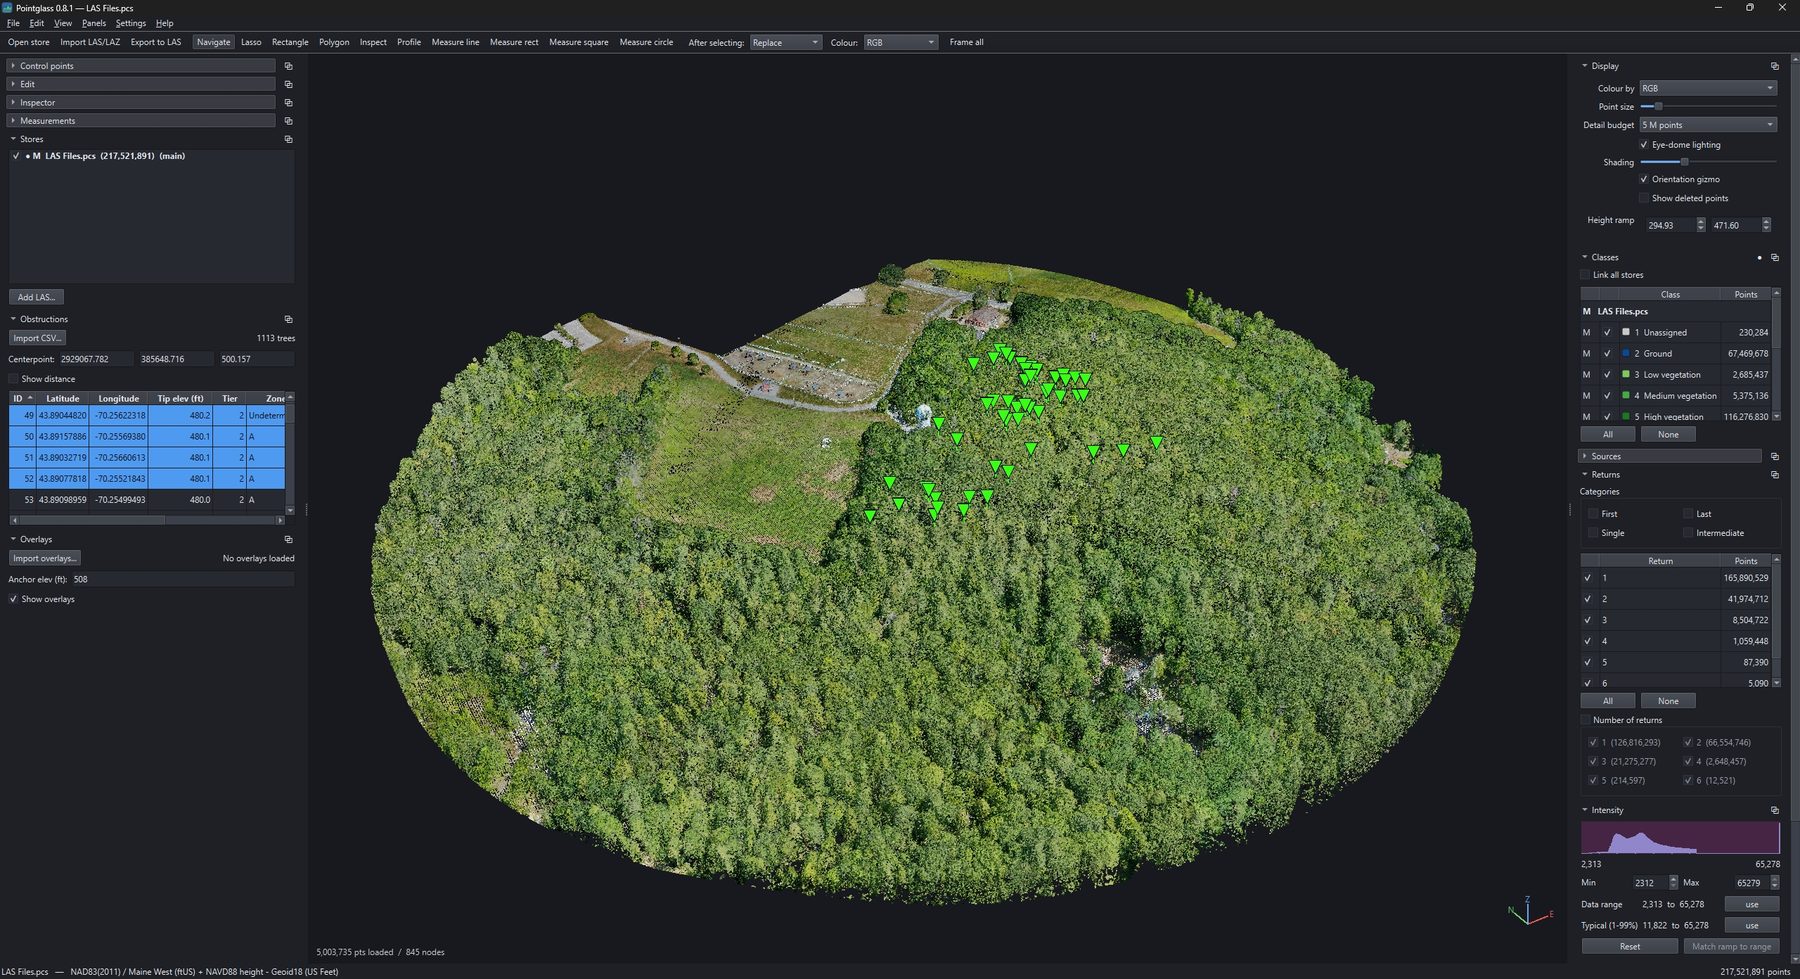
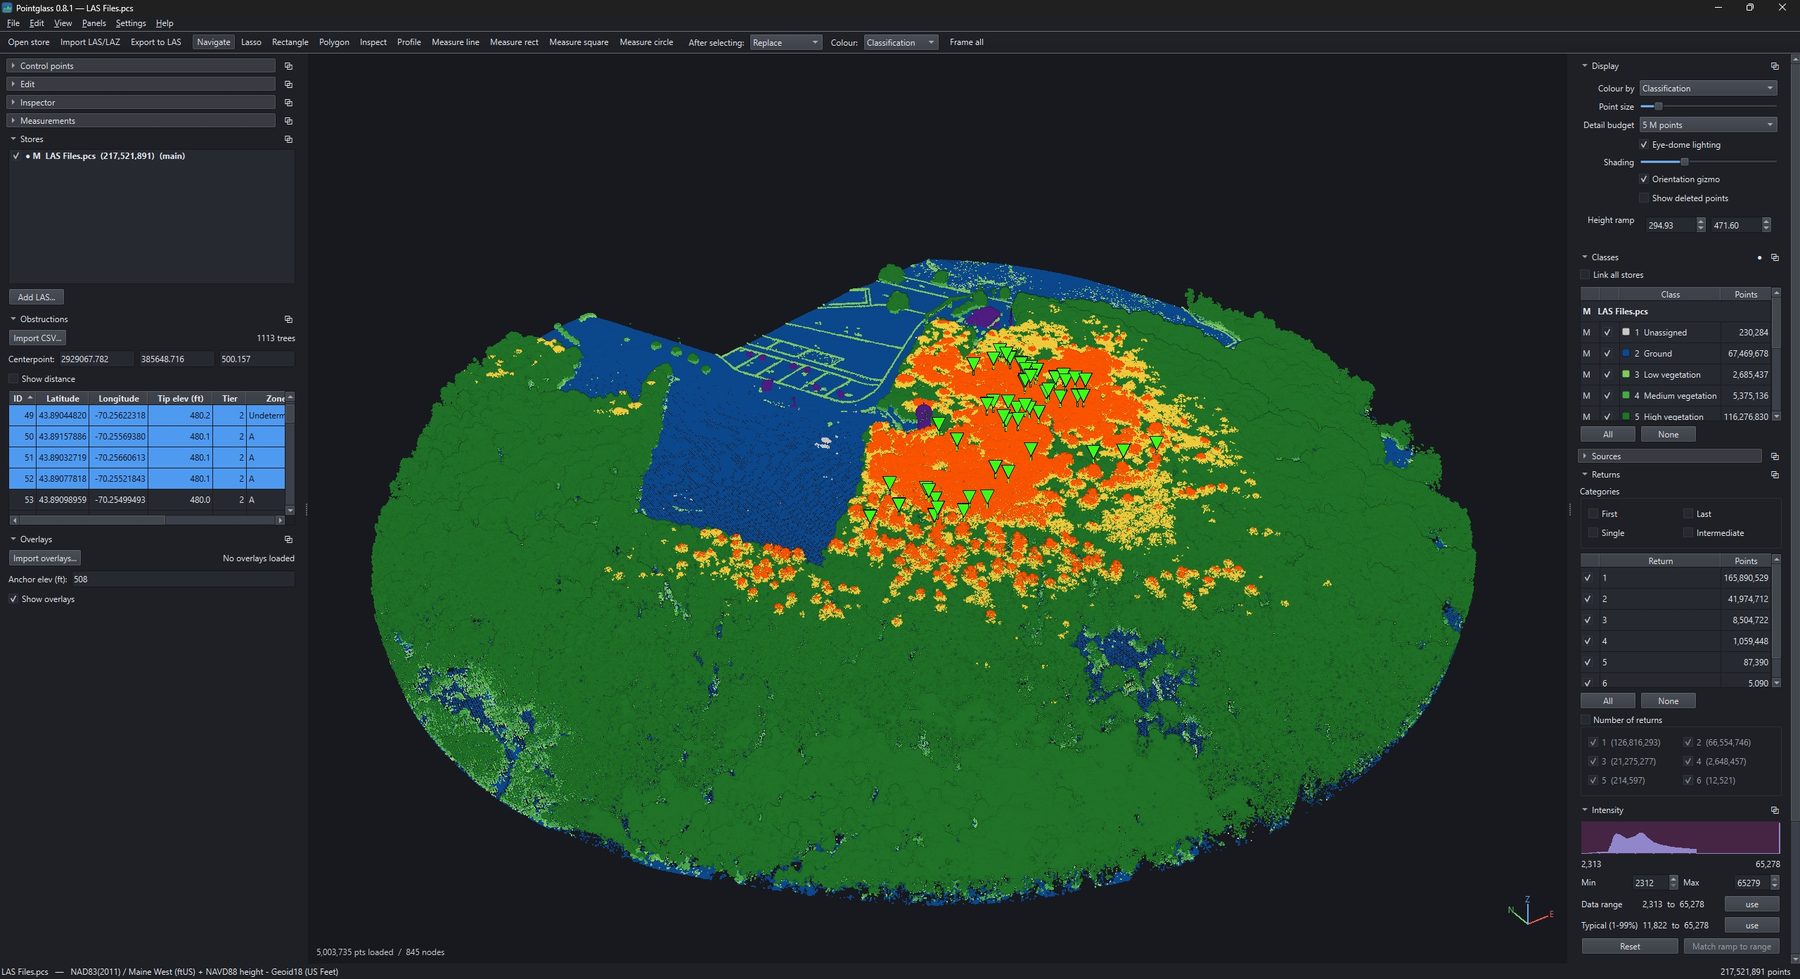
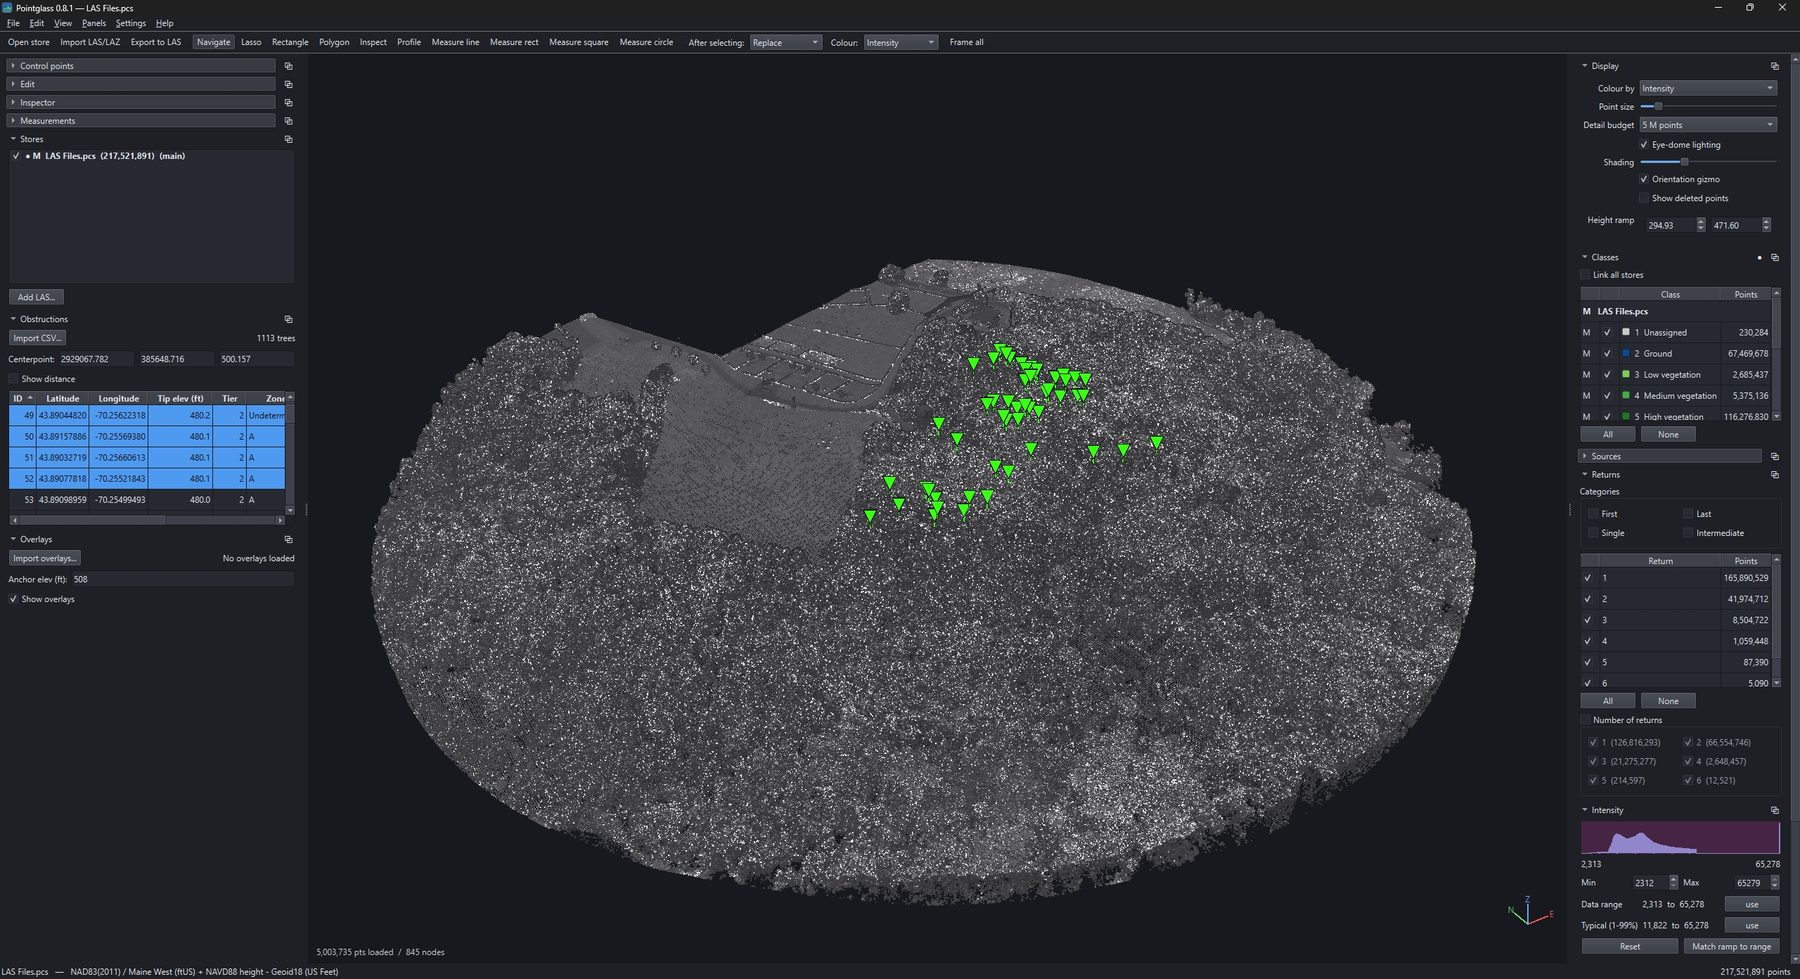
Import an obstruction CSV and each tip lands in the cloud at its own coordinates. Columns are matched by alias rather than by position, so a file that names a column tip_elev and one that names it Tip Elevation (ft) both load.
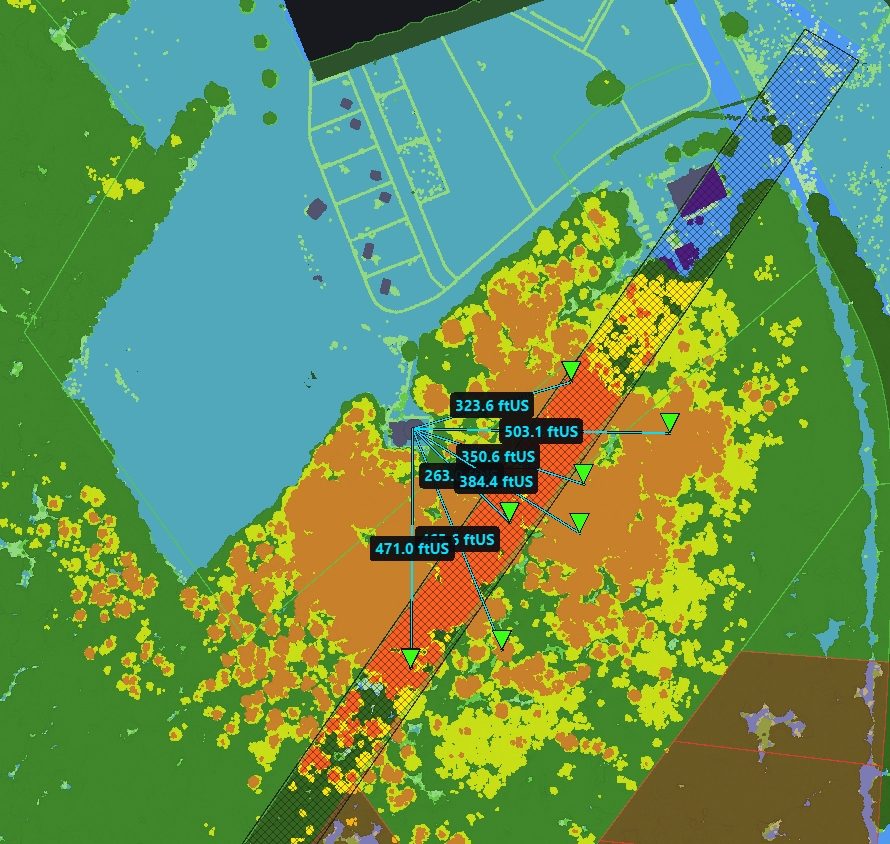
Sort by tip elevation, height above ground, tier or zone. Mark rows and they are drawn in the viewport. Set a centrepoint — a radome, a runway end, a proposed structure — and read the horizontal distance to each marked tree, labelled in the project's units.
- The table pops out. Full-height on a second monitor, sorted numerically — the proxy sorts on the raw value, not the display string.
- Boundaries overlay the cloud. Parcel and zone vectors project onto the surface at an anchor elevation you set.
- Distances are ground distances. Not screen distances, whatever the camera is doing.
Ground or roof? Answer it by looking
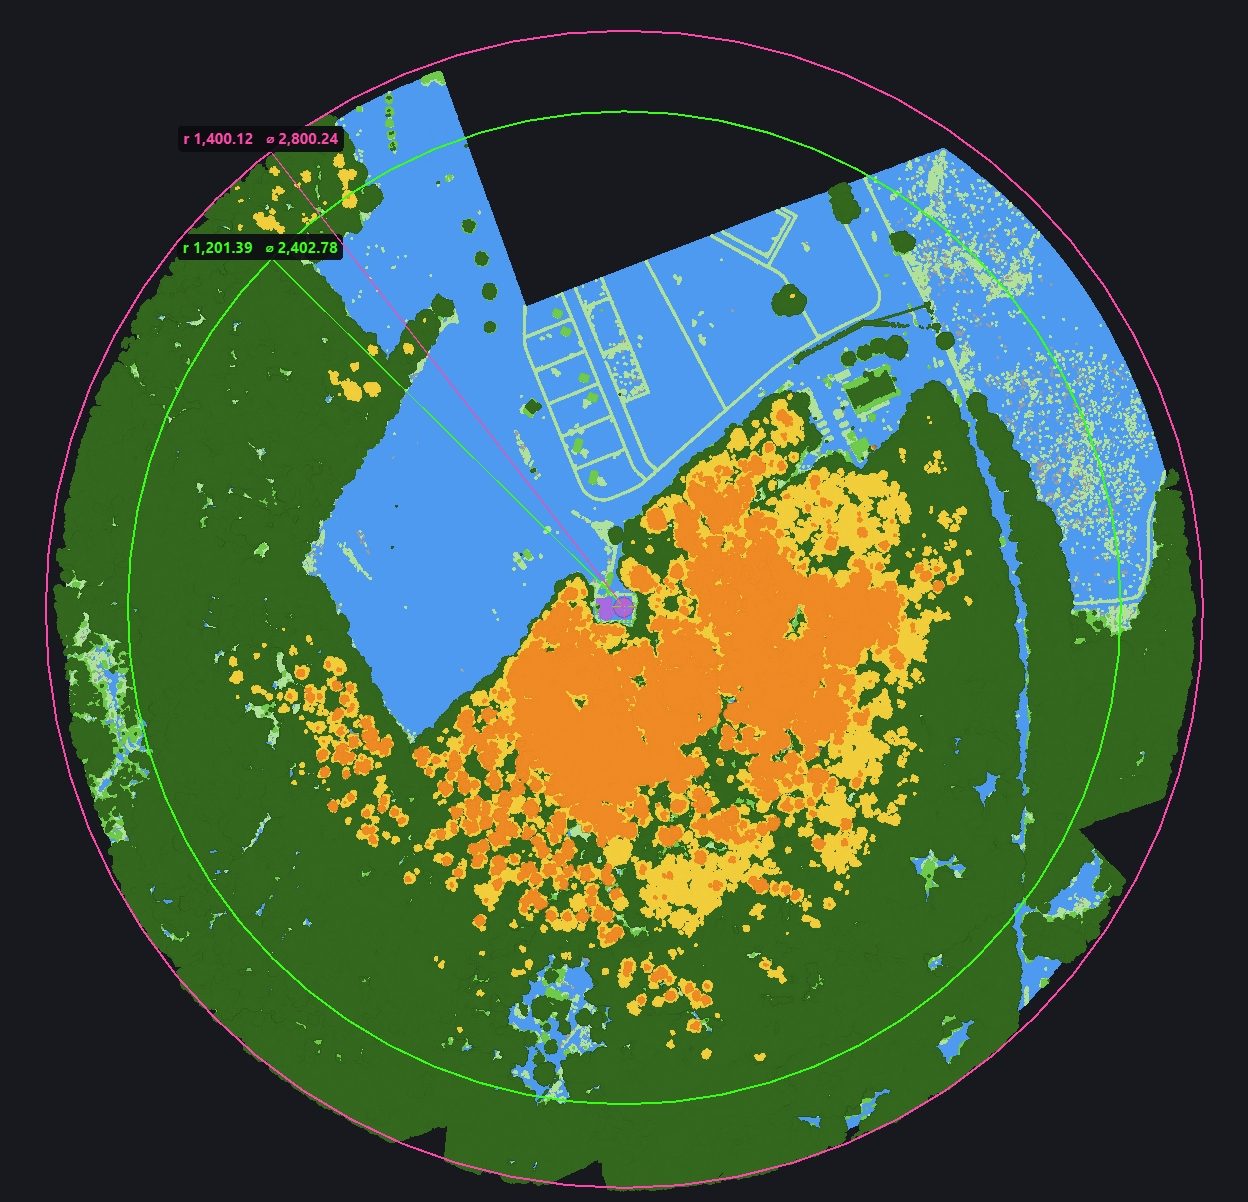
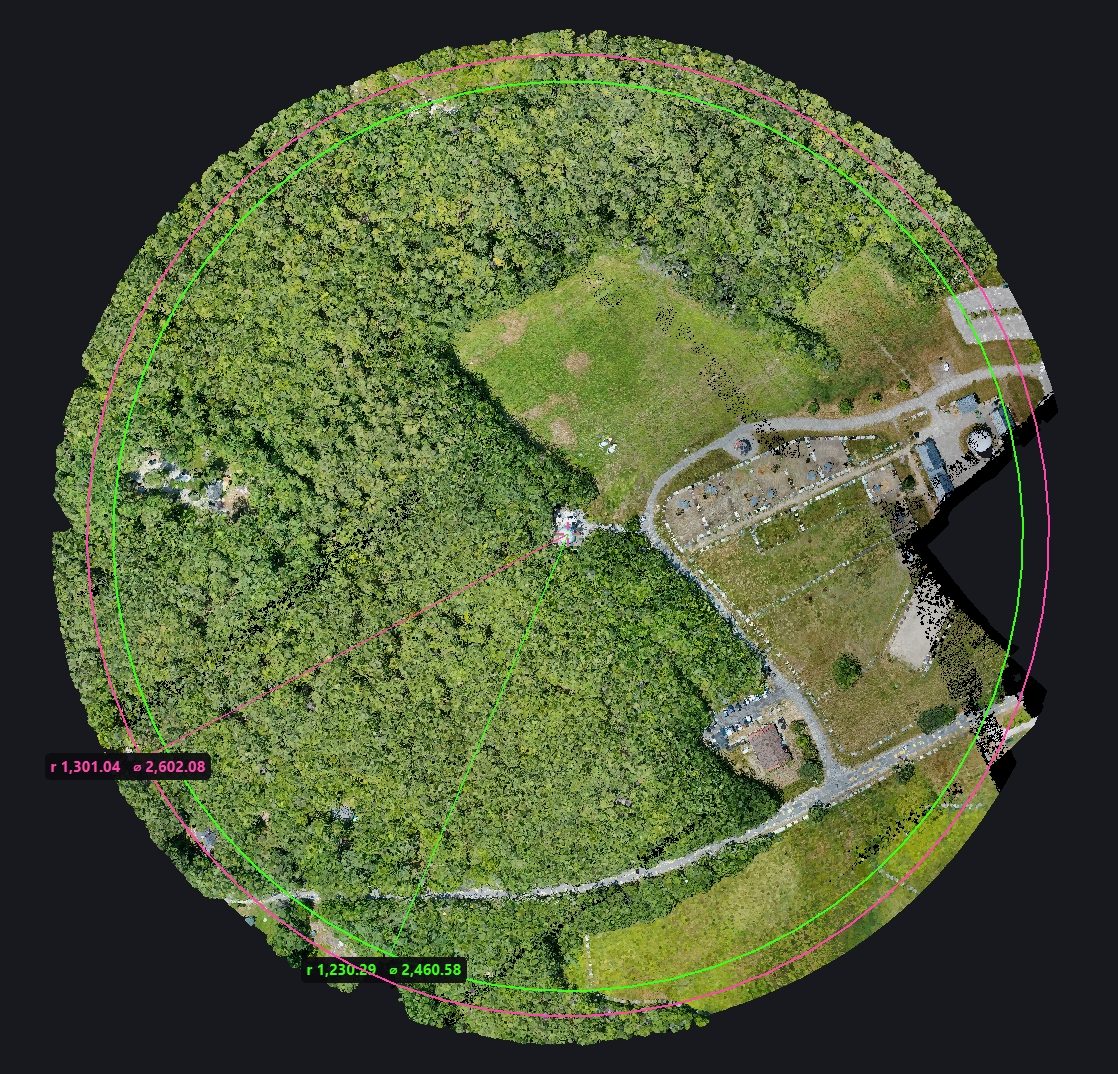
Measurements are drawn straight onto the cloud with live dimension labels. The first click snaps its elevation to the ground-classified surface beneath it — so a circle centred on a radome sits on the ground under the dome, not on its roof — while keeping its XY exactly under the crosshair.
Picking the circle tool snaps the view to a framed top-down plan and holds it there. While the centre is live, an inset shows a vertical section of the square around the crosshair with the anchor's elevation drawn across it. Arrow keys nudge the centre across the plan; PgUp and PgDn nudge its elevation.
- Any closed shape is a trim boundary. It replays through the same pipeline a lasso does, so scope, confirmation and undo behave identically.
- Measurements are saved beside the project. A boundary worked out in one session is there in the next.
Accuracy numbers that survive being read closely
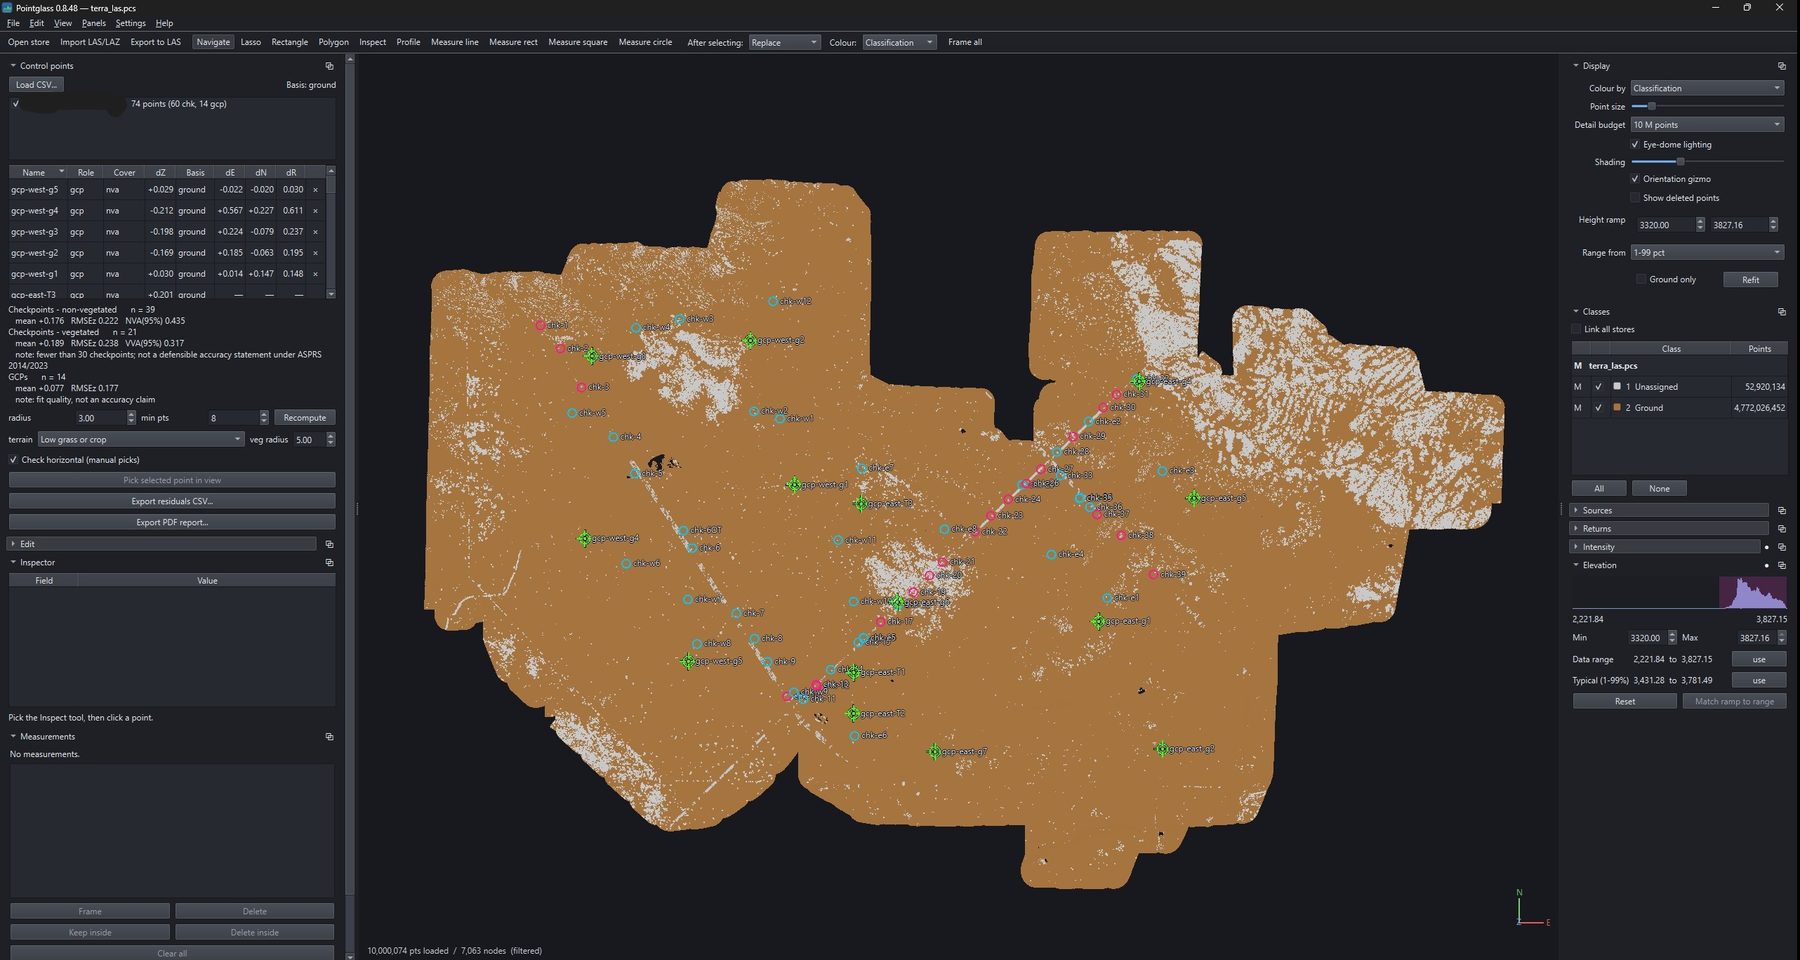
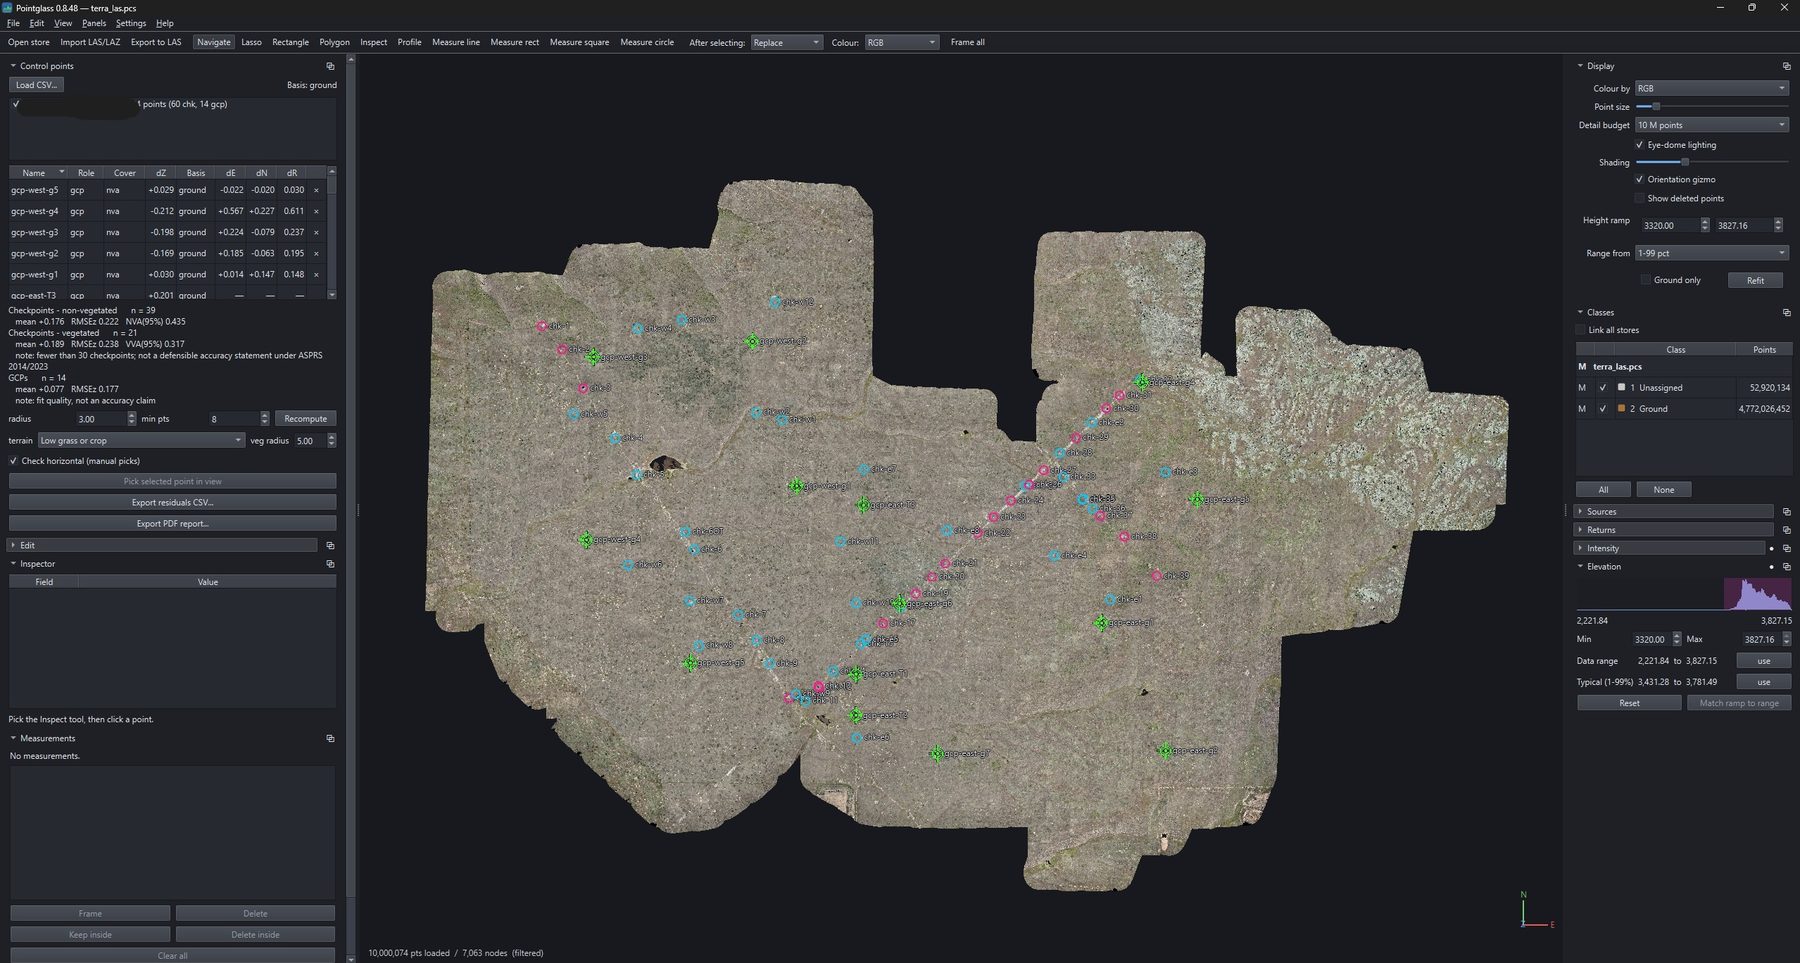
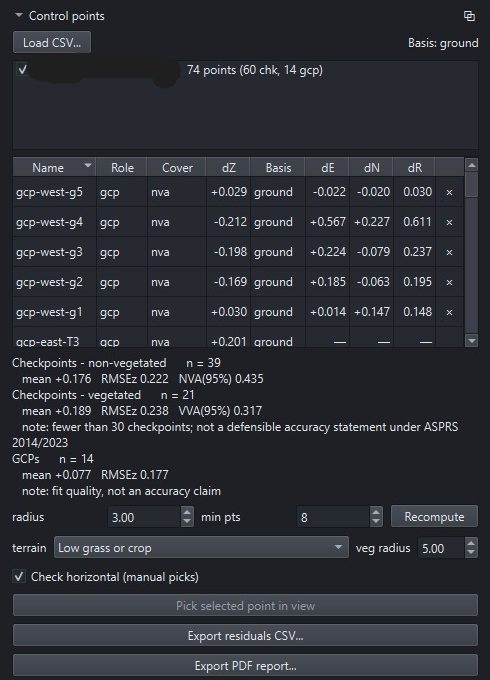
Load a delivered checkpoint or GCP file, fit a plane to the cloud around each point, and read the vertical residual. Columns are matched by alias, so the file you were sent loads as it was sent.
GCPs and checkpoints are kept separate at every level — in the table, in the chart, in the statistics and in the report. A GCP was used to build the model; a checkpoint was withheld from it. Blending them would invalidate the claim the number appears to make.
The disc the plane is fitted in and the disc vegetation is judged in are two different radii, because they answer two different questions. A tight fit describes the checkpoint's own spot; canopy over a checkpoint is rarely directly above it. Measured on a real survey, judging cover inside the fit radius registered vegetation at only ten checkpoints; widening the footprint to its own default moved that to twenty-nine, against a standard that wants thirty in each group. The footprint is now a separate control with terrain presets — and because no standard defines that radius, the presets are named in the documentation as a house choice rather than dressed up as a citation.
NVA95
1.9600 × RMSEz, per the ASPRS Positional Accuracy Standards for Digital Geospatial Data.
VVA95
The 95th percentile of absolute error — because vegetated error is not normally distributed and an RMSE would flatter it.
Marked, not hidden
Edition 2 raised the per-group floor from 20 to 30. A group under it is flagged amber and printed with a plain instruction not to read it as a defensible accuracy statement — including on surveys that cleared the old floor.
Horizontal, when you ask for it
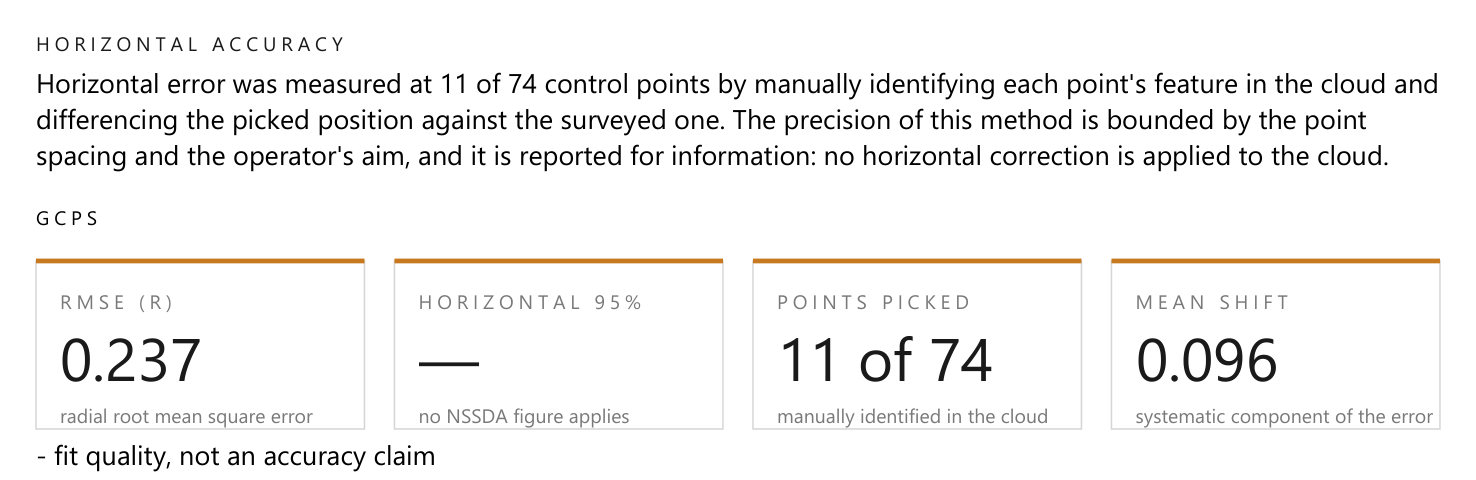
Vertical is what a lidar survey is usually judged on, and it is what Pointglass measures by default. Horizontal is a separate switch in the Control panel, off unless you turn it on — because a horizontal error is something this software reports, never something it corrects.
You place the pick yourself. Automatic panel-finding by intensity contrast is deliberately not implemented: it locks onto a road stripe as readily as onto a target, and a confident wrong answer is worse here than no answer. Each pick is written to a .picks.csv beside the survey — never into it, so a re-export from your survey software cannot silently discard your observations.
- The 95% figure is not one formula, and it does not pretend to be. Equal axes give NSSDA's 2.4477 × RMSEx; comparable axes give the averaged form. Below the standard's own 0.6 axis-ratio floor there is no published expression — so the components and the mean shift are still reported and the 95% claim is withheld, and said to be withheld.
- The picked elevation is discarded. A pick answers where in plan. The fitted plane already answers the vertical question better, and printing both invites two kinds of measurement to be read as one.
- Off means absent, not empty. Unticked, the panel is its five vertical columns, the CSV is byte-for-byte what it was, and the PDF has no horizontal section at all.
- The method states its own floor. A pick cannot resolve finer than the point spacing plus the operator's aim, and the report says so in its lede.
The report is the deliverable
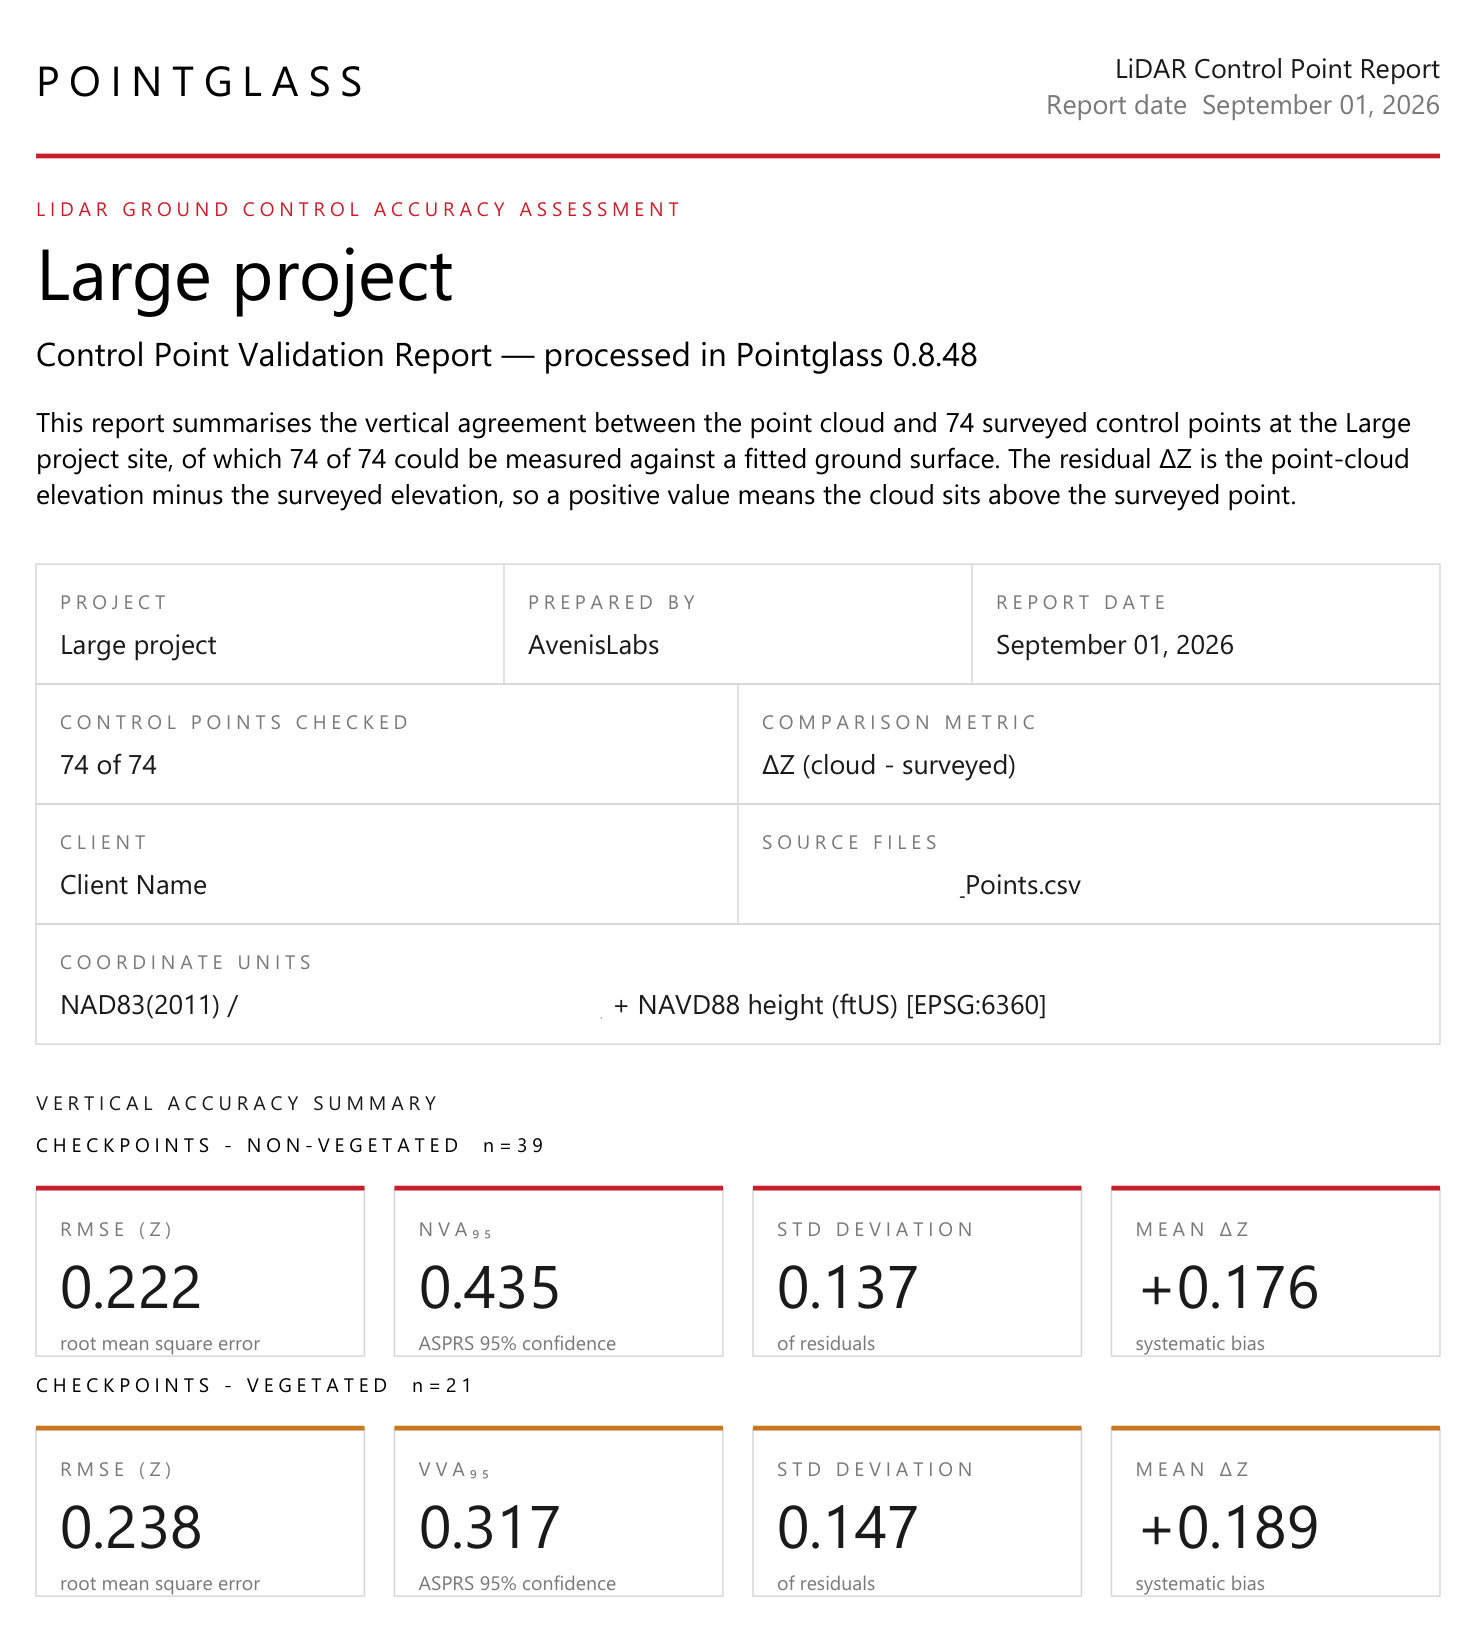
One command produces a client document rather than a screenshot of a table. The same numbers come out as CSV for a spreadsheet.
- Letterhead and a metadata grid — project, date, what was measured, and the coordinate system on its own row, printed whole with both EPSG codes rather than elided.
- Per-group KPI tiles — checkpoints and GCPs reported separately, always.
- A signed residual bar chart with a ±RMSE band, so sign and spread are both visible.
- The residual table, every point, no truncation.
- Horizontal accuracy and per-point offsets — only when horizontal was actually measured.
- Cloud statistics — point total, classification breakdown and returns, read from what the builder already recorded rather than by rescanning billions of points.
- A Qualifications section that is never empty.
- A glossary — including why RMSE and standard deviation are not the same number.
- One full-page crop-marked exhibit per supplied photograph.
Editing a cloud should not change the points you did not edit
Copied, not regenerated
Every surviving point record is copied byte for byte from the original source file, with only its classification byte patched. Headers and VLRs come across intact. The one documented exception is the 48-byte header bounding box, which is recomputed — and says so.
Refuses what it cannot prove
Any declared coordinate system is read natively — the CRS and its EPSG codes are carried through from the source file to the viewport badge to the report, and the linear unit travels with them. What is refused is adding or merging a file whose CRS or unit does not provably match the project: byte-identical CRS records, or exact EPSG authority-and-unit equality. Never converted, never overridable.
Compare without merging
Add LAS or LAZ to a project after its initial build; each addition becomes its own complete sub-store, drawn alongside the others. Exactly one store is active and receives edits. Every store keeps its own history and its own export.
Thirteen panels, and none of them lie to you
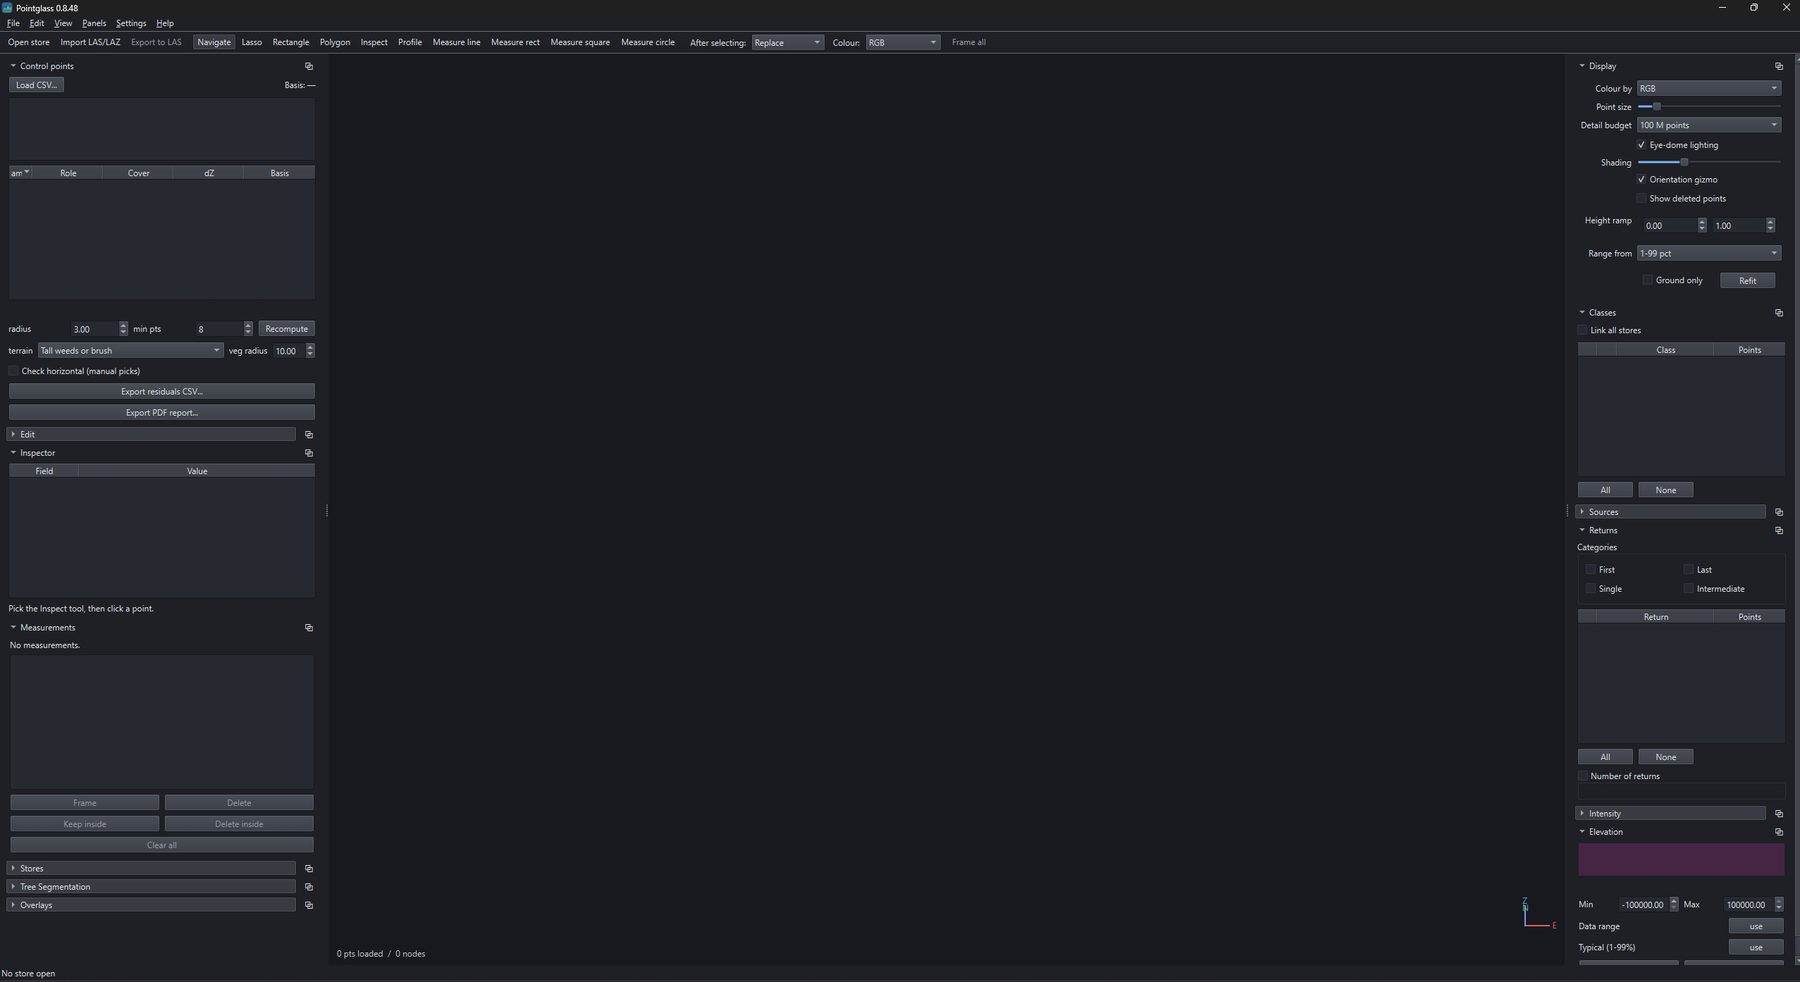
Panels stack as collapsible sections in a rail down each side. A rail scrolls, so every panel keeps its natural height however many are open. A dot beside a panel's title means that panel is still filtering the cloud — a collapsed filter cannot quietly change what you see.
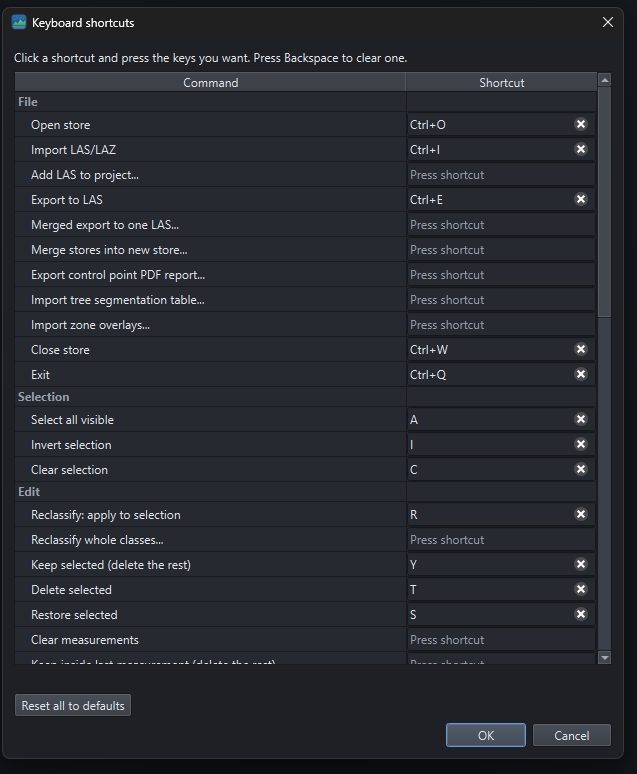
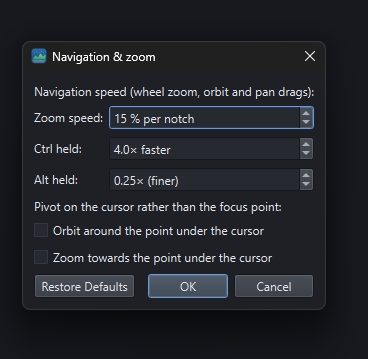
Any panel pops out into its own window and goes back where it was when you close it. Positions, sizes and visibility survive between sessions. Every command has a key, and every key can be changed.
- Read in feet or metres, whatever the file is in. Measurements, profiles, obstructions and the readouts all follow one display-unit setting. The store's own units never change; only what you are shown does.
- The CRS is on screen, not in a dialog. A badge under the orientation gizmo names the project's coordinate system and its unit, so the number you just read can always be attributed.
- Each store remembers its view. Camera, filters and display state are saved per store and restored when you open it again.
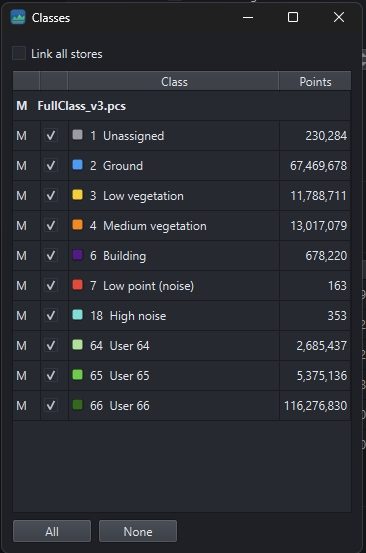
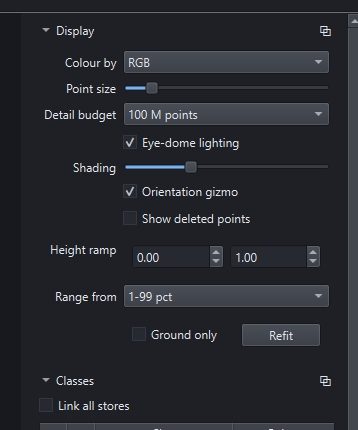
- The elevation ramp explains its own range. Choose the rule — percentile, median ± MAD, or the full declared box — restrict it to ground, refit it on demand, and read it against a legend drawn from the ramp itself. Noise a thousand feet below ground stops deciding what the colours mean.
A LAS file is stored in the order the sensor fired
That order is useless for interactive work, and a multi-gigabyte LAS cannot be edited in place. So the first thing Pointglass does is rewrite the cloud into a spatially indexed store that separates immutable geometry from a small mutable attribute layer. A node's points are a contiguous slice of one file, which is why drawing one is a direct upload to the GPU and why level-of-detail streaming keeps a multi-billion-point project interactive — the 4.29-billion-point store ceiling came out, and the largest survey on record is 4.82 billion.
The second decision is a boundary. Geometry, statistics, report composition and the click grammars are Qt-free modules; the widgets are reduced to wiring. A test enforces it. That is why a desktop application can carry thousands of tests, and why the command line runs on an interpreter with no Qt installed at all.
This is early alpha, and it says so in the title bar
Pointglass is a working application, acceptance-run against real survey deliverables — and it is version 0.8.48. The version scheme is deliberately fine-grained: patch bumps are the norm and a large patch counter is expected. Version 1.0 will be an explicit decision, not somewhere the counter arrives.
There is no public download yet. If your work looks like the work in these screenshots, get in touch and say what you are trying to do with it.
The form below reaches me directly.
| Operating system | Windows |
| Graphics | Any GPU and driver supporting OpenGL 3.3 core — roughly 2010 onward. The window says so plainly rather than opening blank. |
| Runtime | Python 3.12+, numpy, laspy. Installed on first run. |
| Desktop window | PySide6, about 150 MB, installed on first run. |
| Optional | pyproj for the CRS gate's EPSG fallback; reportlab for the client PDF. Each degrades to a clear message rather than a crash. |
Say what you are trying to do with it
There is no public download yet, and access is handled one conversation at a time. The most useful thing you can tell me is the shape of your work: how large the surveys are, what you deliver, and which part of it is currently painful.
Nothing here is stored on the site — the message is relayed straight through and answered by email.